
What History Says About the Future
Letter Summary
Despite volatility through the year with an initial sell-off amid an artificial intelligence (AI) scare and a deeper decline after announced tariffs, the U.S. equity market ended the calendar year much like it has the past several—up around 20% and largely due to valuation expansion (see Figure 1 below). U.S. equities are consequently historically expensive by any measure and at a valuation level that has typically been associated with much more subdued future returns. Looking past the market’s top leadership, though, reveals many high quality stocks that remain very attractively valued and our large cap strategy is trading at a free cash flow yield on next twelve month estimates that is more than double the comparable metric for the S&P 500 and over 60% above that of the Russell 1000 Value benchmark, which also looks richly valued. We are also finding significant opportunities in smaller stocks where avoiding high debt levels and money-losing businesses has historically been smart but was an enormous drag on returns in 2025. International stocks also look very appealing even after significant outperformance in 2025, but selectivity remains key.
In thinking about future prospects, valuation expansion is not a source of returns that can last forever. Historical returns going back to 1900 show that while rising valuations can add significantly to returns for stretches of time, these periods have invariably given way to the vicissitudes of sentiment. Smoothed out over time, these shorter-term swings in valuation net out to a near zero contribution such that fundamentals are the only real driver of returns, as makes logical sense. In this context, while a significant portion of the market returns since the inception of our firm have resulted from multiple expansion, for all of our strategies returns have been entirely driven by fundamental gains as measured by the combination of dividends and real free cash flow growth. Looking forward, we feel much more confident about the sustainability of such returns and especially so in the face of very rich market valuations.
Performance Summary
U.S. Fundamental Stability & Value (U.S. FSV): Amid a strong valuation expansion fueled rise in stocks, our U.S. FSV strategy net of fee return of 8.59% in 2025 lagged the S&P 500’s comparable gain of 17.86% and the Russell 1000 Value’s 15.88% gain. Annualized net of fee performance since inception is now 0.98% behind that of the S&P 500 and 4.18% ahead of the Russell 1000 Value Index (RLV).
U.S. Small/Mid Cap Quality & Value (SMID QV): Our SMID QV strategy returned 2.63% in 2025 on a total return basis and lagged the Russell 2000 index (RTY) by 10.2% and the Russell 2000 Value index (RUJ) by 10.0% as unprofitable stocks outperformed significantly. Annualized excess returns of our SMID QV since inception are 3.8% and 3.9% ahead of those benchmarks, respectively.
International Fundamental Stability & Value (Intl. FSV): Amid a general outperformance of international stocks, our International FSV strategy’s total return of 41.53% after fees exceeded the MSCI All Country Ex US ETF benchmark’s gain of 32.48%. Annualized net of fee performance since inception is ahead of the benchmark by 0.85%.
U.S. Large Cap Value Long 130%/Short 30% (U.S. Value 130/30): Our 130/30 strategy returned 14.36% net of fees in 2025 vs. the S&P 500 Index (SPX)’s return of 17.86%. This strategy is 1.4% ahead of the S&P 500 on an annualized net of fee basis and leads the Russell 1000 Value Index by 6.6% since inception.
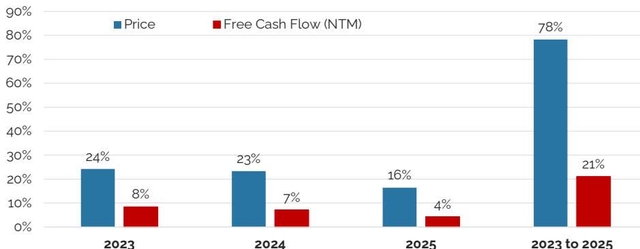
Over various recent timeframes, price has far exceeded fundamentals for the S&P 500.
Figure 1: Price vs. Free Cash Flow (NTM) Change
Source: FactSet, data as of 12/31/2025 Past performance does not guarantee future results. One cannot invest directly in an index.
Valuation Concerns:
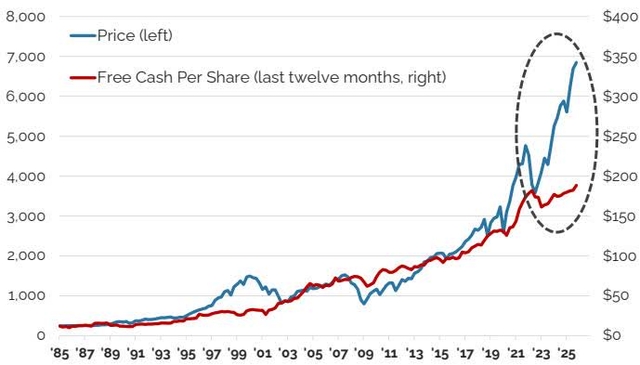
Despite significant volatility during the year with an initial decline amid AI jitters and then a sharp drop following the announcement of tariffs, U.S. equity markets ended 2025 remarkably similarly to the prior two years—with a roughly 20% gain that far exceeded fundamental growth. The extent to which equity prices have consequently diverged from underlying fundamentals in the past few years is evident in Figure 2 .
Price increases for the S&P 500 continue to exceed free cash flow gains.
Figure 2: S&P 500 Free Cash Flow vs. Price
Source: FactSet, quarterly data through 12/31/2025, trailing free cash flow per share.
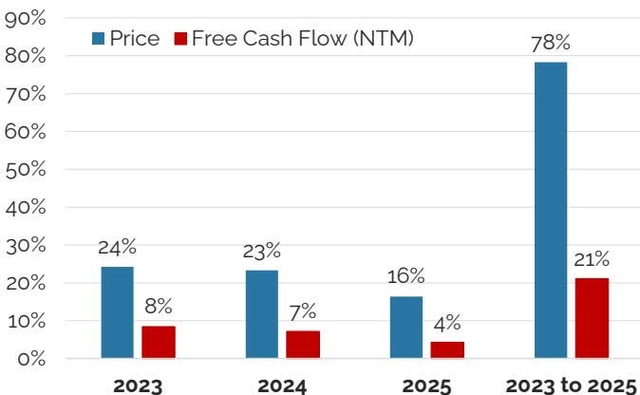
Figure 3 contrasts price gains and changes in consensus-estimated next-twelve-month (NTM) free cash flows (FCF) and highlights that over the last three years price is up almost 80% compared to an increase in free cash flow of just 21%. While the current divergence between price and fundamentals is substantial, it is far from anomalous in the history of equity returns. Quite the contrary, it actually fits a pattern where valuation expansion cycles are a meaningful driver of equity gains for a stretch of time before becoming notable headwinds.
Over various recent timeframes, price has far exceeded fundamentals for the S&P 500.
Figure 3: Price vs. Free Cash Flow (NTM) Change
Source: FactSet, data as of 12/31/2025
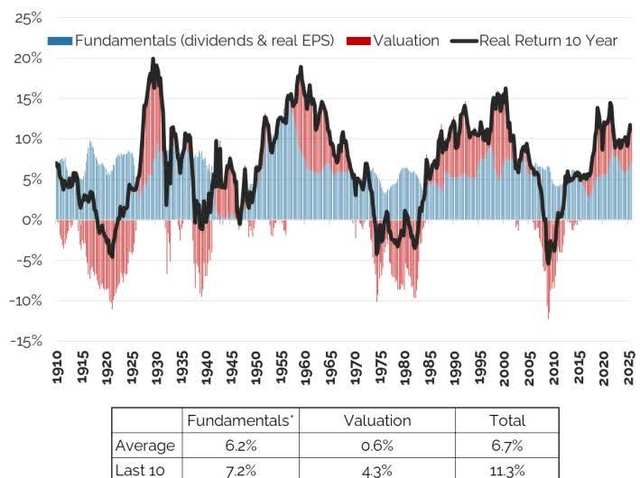
Going all the way back to 1900, we can split 10-year rolling real returns into two components — valuation changes and fundamental gains. Fundamentals in this case combines dividends and growth in max trailing earnings per share (EPS), a measure we utilize that diminishes the economic volatility in earnings and better reflects underlying earnings power. We use earnings and not our preferred measure of free cash flow in this analysis as free cash flow data only goes back to the mid-1980s. The resulting split of returns shown in Figure 4 demonstrates that while real fundamental growth is a reasonably steady driver of returns (blue bars), valuation changes (red bars) swing dramatically, adding to and then detracting significantly from returns over stretches of many years.
The current run of valuation expansion does not look unusual in this context and is consistent with what occurred previously in the 1920s, 1960s and 1990s. Notably, however, each of those periods gave way to stretches in which valuation changes went the opposite direction and exerted a large drag for shareholders. This is consistent with the fact that over the very long-term, valuation changes average to approximately zero contribution, and fundamentals are the only real driver of returns. The historic averages are shown in the table below Figure 4 along with the data for the last ten years.
It is not unusual for valuation expansion to occur for multiple years and to add meaningfully to returns as has happened recently, but it is also very normal for reversion to take place, as has been the case following in each of the prior periods of similar multiple expansion. Valuation tends to be a good predictor of such reversals, but only when measured over longer time frames – longer than many investors typically consider.
While the fundamental (real earnings and dividends) contribution to 10-year real returns is fairly steady and average around 7%, valuation changes tend to add or detract meaningfully for stretches of time but average out to near zero.
Figure 4: 10 Year Real Equity Returns (S&P 500) Split by Fundamental vs. Valuation Changes
*Contribution from dividend plus growth in real trailing max EPS. Source: FactSet
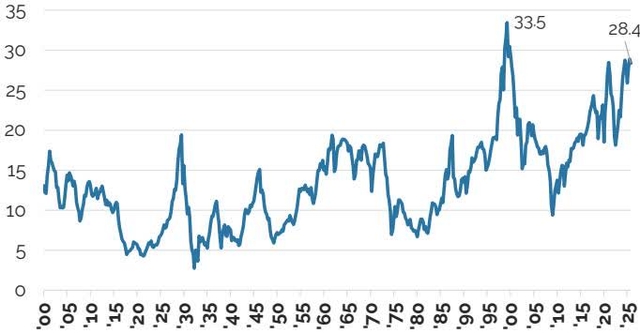
To that point, after several continuous years of valuation expansion, U.S. equities are now trading near record multiples measured by max trailing earnings per share (See Figure 5 ).
The S&P 500 is near a record valuation multiple.
Figure 5: S&P 500 P/E on Max Trailing EPS
Source: FactSet; see methodology note at end of paper.
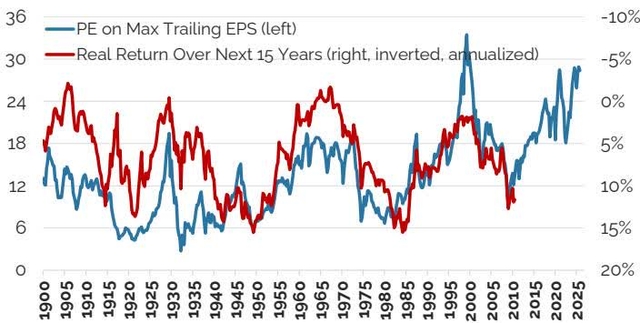
What is to follow? Figure 6 shows the same starting P/E on trailing EPS on the left axis overlaid with real returns over the next 15 years on the right axis on an inverted scale. This tight link demonstrates that rich starting valuations correlate with lower longer-term returns and vice versa. With current valuations at a record exceeded only in the tech bubble 25 years ago, this points to significant valuation risk and potentially much more subdued equity gains going forward.
While valuation does a poor job of predicting short-term returns, it lines up well with real returns over the next 15 years which is troubling given the current market richness.
Figure 6: S&P 500 P/E On Max Trailing EPS vs. Real Return Over the Next 15 Years
Source: Robert Shiller Online Database, FactSet, data as of 12/31/2025; see methodology note at end of paper.
Though the overall market is trading at a concerning rich valuation, this is primarily due to a short list of very large and expensive stocks. This can be seen in Figure 7 , noting the current free cash flow multiple on NTM estimates for a group we call the Big & Rich 20 that includes the Mag 7 plus Oracle (ORCL) and Broadcom as well as the next most expensive 11 stocks with market caps over $200 billion.
Much of the market’s rich valuation is concentrated in only a few stocks as just 20 that account for over half the market are trading at around a 120% premium to the rest of the market.
Figure 7: Market Cap to NTM FCF For the Big & Rich 20* vs. The Rest of the Market and Distillate’s U.S. FSV
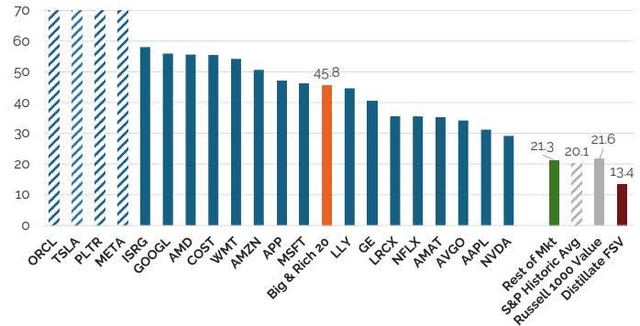
This concentration of richness is remarkable in that just 20 stocks now account for over 50% of the S&P 500 by weight and are collectively trading at a 120% premium to the remainder of the market.
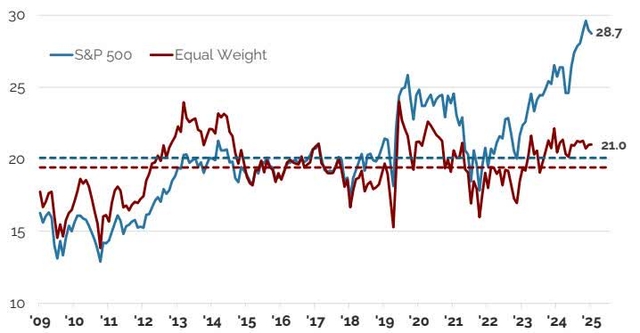
In another view, we compare the valuation of the standard capitalization-weighted S&P 500 with that of the equal-weighted S&P 500. While the cap-weighted S&P 500 is now trading at an historically rich 30x NTM FCF, about 50% above its average, the equal-weighted S&P 500 is far cheaper at 21x and just 10% above its average (See Figure 8 ). While this divergence looks very unusual, there is a precedent for a similar disconnect 25 years ago.
The richness of just a few very large stocks has driven the S&P 500 P/FCF (NTM) multiple to near 30x and a ~50% premium to its average while the equal weighted S&P 500 is trading at 21x or a 10% premium to its average.
Figure 8: P/FCF (NTM) S&P 500 vs. Equal Weight
Source: FactSet, data through 12/31/2025
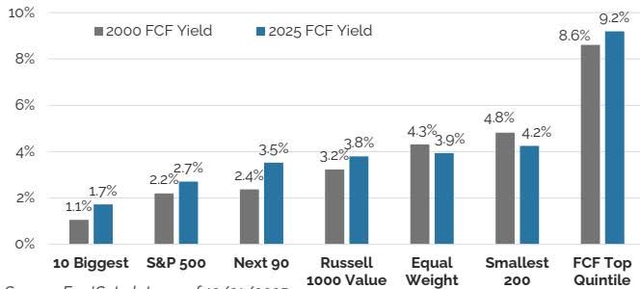
NTM free cash flow estimates were not available 25 years ago, but Figure 9 utilizes trailing free cash flow yields to compare the market now with where things were back in 2000. Importantly, even though the S&P 500 was very expensive at a 2.2% free cash yield in 2000 (and is very rich again today), many stocks were considerably less expensive as is the case again now.
The market structure today in terms of valuation by size is remarkably similar to the last time it was as richly valued 25 years ago.
Figure 9: Free Cash Yield (Trailing Twelve Month) In 2000 vs. Today For Various Benchmarks & Stock Groups
Source: FactSet; data as of 12/31/2025
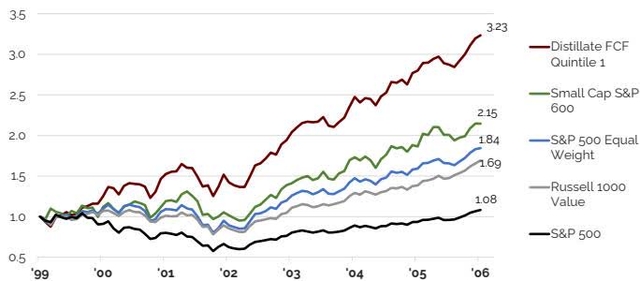
Most crucial in this analysis is what happened after the peak 25 years ago. While the overall market took 6 years to regain its old high, less expensive and smaller stocks did substantially better and the cheapest quintile of stocks on Distillate’s measure of free cash flow yield performed exceptionally well (See Figure 10 .) The market differentiated quickly, with enormous dispersion in subsequent returns based on starting valuations.
Digging into the composition of returns over this period is also revealing. Using the equal weight as an example and returning to the split of fundamental vs. valuation changes from before, fundamental growth (NTM EPS since NTM FCF wasn’t available) from ’00 to ’07 was similar for both the Equal Weight and S&P 500 at ~70%. Valuation changes, however, were starkly different with the S&P 500’s multiple down ~40% while the equal weight was up modestly. So the entirety of the return differential resulted from valuation changes that largely reversed the large preceding disconnect. If what is past is prologue, valuation could again become an enormously important differentiator of performance in the coming years.
While the overall market struggled under the weight of its rich valuation after 2000, cheaper stocks did significantly better.
Figure 10: Post 2000 Performance of Various Equity Benchmarks and Groups of Stocks
Source: FactSet; data as of 12/31/2025; see methodology note at end of paper.
U.S. Large Cap Strategy
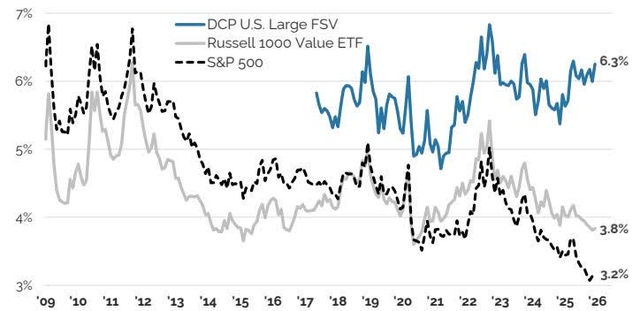
While the overall market has driven free cash flow yields lower, the valuation discipline employed by our U.S. FSV strategy has allowed its free cash flow (NTM) to enterprise value (EV) yield to remain stable, and at a level not significantly different than where it has been since it funded in 2017. The difference between our U.S. FSV strategy’s valuation and that of the broader market is consequently substantial and offers what we believe to be an extremely important point of differentiation. Crucially, this is true whether comparing our strategy to the S&P 500 or the Russell 1000 Value benchmark, where the free cash flow yield is only marginally better—a key issue we believe many investors who are worried about valuation are missing at present (See Figure 11 ).
Distillate’s U.S. FSV is significantly cheaper than its benchmarks.
Figure 11: Free Cash (NTM) to Enterprise Value (EV) Yield for Distillate’s U.S. FSV vs. Benchmarks
Source: FactSet; See end-notes for methodology. Data as of 12/31/2025
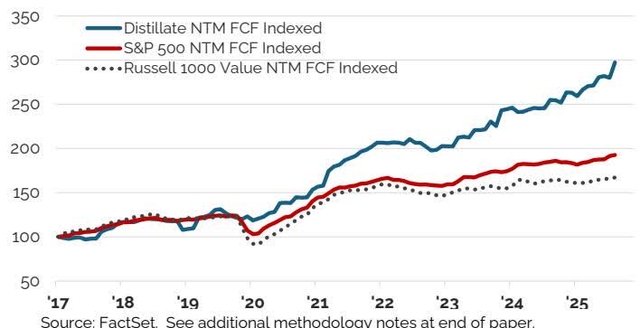
In addition to being highly differentiated from both the S&P 500 and Russell 1000 Value benchmarks on valuation, our U.S. FSV strategy has also produced a markedly different trajectory of underlying fundamental gains. Because the strategy systematically rotates out of names that have increased in value and then reinvests that cash into less expensive stocks that meet its cash flow stability and indebtedness thresholds, there is a significant rebalancing benefit that contributes to stronger underlying free cash flow growth. Indexed free cash flow has resultingly increased significantly more for our U.S. FSV strategy than is the case for the benchmarks as is evident in Figure 12 .
Underlying free cash flow growth has been better for Distillate’s U.S. FSV strategy than for its benchmarks.
Figure 12: Indexed NTM Free Cash Flow
Source: FactSet. See additional methodology notes at end of paper.
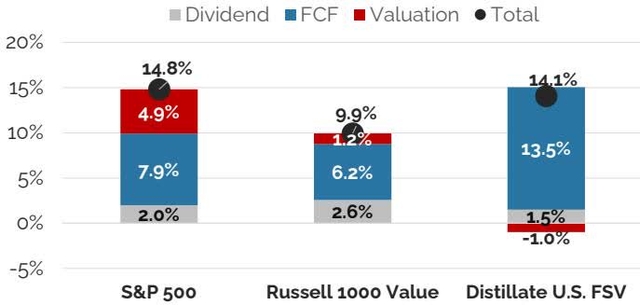
Knowing that valuation changes ultimately net out for the market and that fundamentals are the only real sustainable driver of returns, as was highlighted in Figure 4 , we believe the better performance of underlying free cash flows for our U.S. FSV strategy is of enormous consequence. Instead of generating significant returns from valuation expansion, which is not sustainable, our strategy’s returns since inception have come entirely from stronger fundamental gains (See Figure 13 ).
Valuation has been a key driver of market returns while all of Distillate’s gains came from fundamentals.
Figure 13: Composition of ’17 to ’25 Returns
Source: FactSet. See additional methodology end notes.
This same composition of returns in our view is vitally important in thinking about the potential drivers of future performance. Given the current multiples on the S&P 500 and Russell 1000 Value, it would be very unusual for either to see significant further gains from multiple expansion. Far more likely in our view and given history is that multiple changes may actually become a drag on returns as has occurred following similarly rich valuations through history.
While we view this as a considerable risk and feel our strategy is well designed to weather such a scenario, we are also optimistic about our strategy’s prospects if such an environment is avoided. In a comparative sense, our strategy’s stronger underlying fundamental growth was outrun by the valuation expansion component of returns for the broader market. Our strategy resultingly has lagged the S&P 500 since inception and did so more substantially in recent years even as it has outperformed its value benchmark considerably since inception. Without the benefit of valuation expansion for the S&P 500, our strategy would have handily outperformed and we are optimistic that it may do so in the future if fundamental outperformance continues and the relative headwind from valuation expansion for the market merely dissipates rather than reverses even though the latter seems more likely from a historical perspective.
Thinking about our portfolio’s positioning as though it were a single stock, it would be one that has shown much better fundamental growth than the market, is much more diversified than the very concentrated S&P 500, has shown much greater underlying fundamental stability, and is trading around half the valuation. This is a set of attributes about which we are optimistic, whatever the coming years bring.
U.S. Small/Mid Cap Strategy
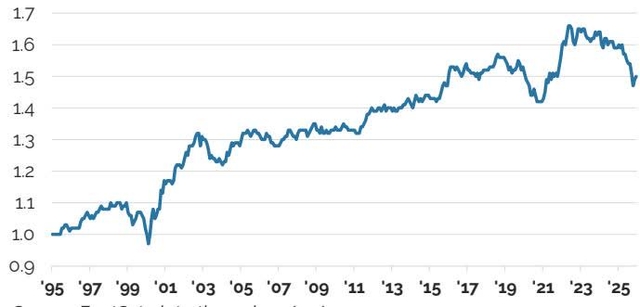
We see a significant opportunity in small and mid-sized U.S. stocks. Within this space, however, there are an alarmingly large number of unprofitable and heavily-indebted companies, making selectivity critical in our view. Versus the Russell 2000, the S&P 600 excludes many of these troubled names and is consequently a more attractively-valued benchmark of much higher quality constituents. Over time, the S&P 600 has considerably outperformed the Russell 2000 as is clear in Figure 14 . The same logic is the reasoning our small/mid strategy similarly filters out negative free cash flow companies and avoids those with high amounts of leverage while seeking out attractive valuations. Our strategy has notably outperformed both the S&P 600 and the Russell 2000 considerably since inception. But even though the higher quality S&P 600 has significantly outperformed the Russell 2000 over time, there are moments when it lags. This occurred in the tech bubble in the late 1990s, the meme stock craze, and again recently.
The higher quality S&P 600 has outperformed the Russell 2000 over the long term but has lagged recently as quality has underperformed.
Figure 14: S&P 600 Relative to Russell 2000
Source: FactSet, data through 12/31/2025
The recent underperformance of the higher quality benchmark and our own strategy is due to the fact that while negative earning companies are more typically a drag on returns, they have meaningfully outperformed in the last several quarters. Figure 15 highlights returns in 2025 by staring NTM free cash flow yield and shows stocks that started the year with negative free cash flow yields (and that comprised a significant ~35% of the index) rose on average by a rather stunning 67%.
Small stocks with negative projected free cash flows at the start of the year outperformed massively.
Figure 15: Russell 2000 Performance in 2025 by Starting Free Cash Yield
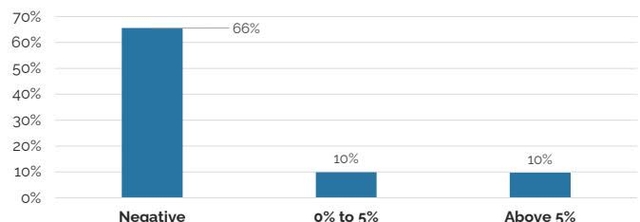
Source: FactSet, data as 12/31/2025, equal weighted average, market cap change. Negative includes 35% of stocks by weight with NTM FCF data, 0% to 5% includes 40%, and over 5% includes 25%.
The extraordinary outperformance of negative earning stocks that comprise a substantial portion of the smaller stock universe demonstrates what an unusual period the current one has been.
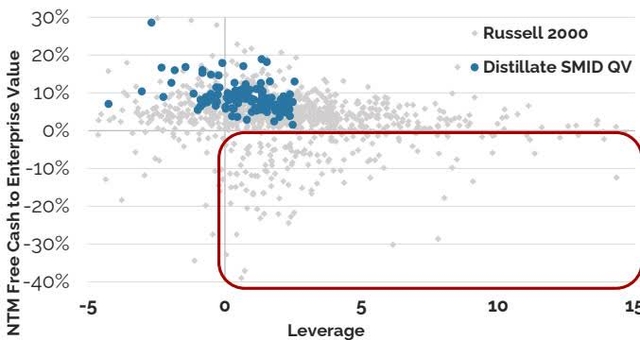
A second element of benchmark risk in the small/mid stock space is the degree to which many companies are indebted. Figure 16 depicts the financial leverage and valuation of our holdings against all the constituents of the Russell 2000. The number of highly levered businesses is notable as is again the number with negative or very low free cash yields.
The Distillate U.S. Small/Mid Cap strategy selects stocks at the intersection of low debt and attractive valuation, as measured by free cash yields. We highlight a risk in the small cap market of companies that not only have high debt levels but are cash flow negative – a dangerous combination in our opinion.
Figure 16: Small/Mid Stock Valuation vs. Leverage
Source: FactSet, data as of 12/31/2025
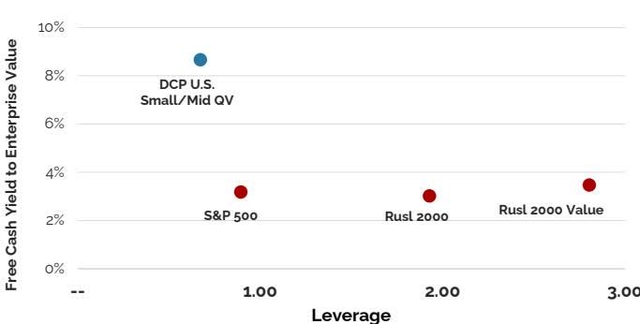
When our holdings are aggregated to the portfolio level, the differentiation on valuation and leverage is even more stark with our U.S. Small/Mid strategy offering a valuation that is more attractive than its benchmarks and the S&P 500 while also having considerably less debt (see Figure 17 ).
The Distillate U.S. Small/Mid Cap strategy not only has a large valuation advantage versus large and small indices but does so without the high debt levels the broad small cap universe presents.
Figure 17: Small/Mid Strategy Valuation vs. Leverage
Source: FactSet, See end-notes for methodology. As of 12/31/2025
International Strategy
International stocks are likewise an area where we are seeing significant opportunity, but again where we believe selectivity as key. After a long stretch of underperformance, international stocks significantly outperformed their domestic counterparts in 2025, and the less expensive portions of the market did particularly well. Our strategy in this environment outperformed significantly, rising by 41.5%, net of fees in 2025.
Fifteen years ago, international stocks were more expensive than U.S. equities when measured against free cash flow generation. International companies then also had more debt, a legacy of less stable cash flow generation, and offered slower growth. In combination, this made the U.S. market look like a compelling case despite much commentary to the opposite and investor enthusiasm for foreign securities at the time. It is no surprise to us then that U.S. stocks subsequently outperformed in a meaningful way. Today, however, commentary and sentiment are starkly different and U.S. stocks are more expensive amid talk of “U.S. Exceptionalism.”
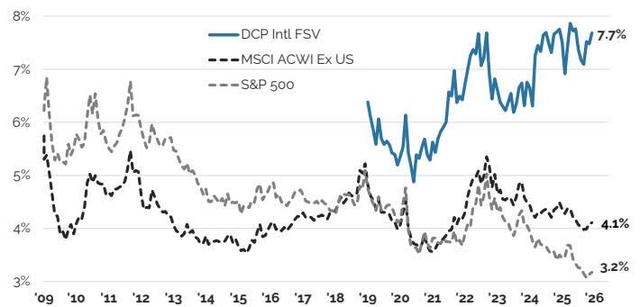
The history of overall U.S. and international valuations as well as that of our own strategy are shown in Figure 18 . International stocks do still have more debt and less stable cash flow profiles, but that risk can be reduced by filtering out highly levered or fundamentally less stable companies as our investment process does. When this is done, we believe international stocks offer an important counterbalance to the richness of the broader U.S. when selectively chosen and are of significant appeal in addition to being beneficial from a diversification perspective.
Distillate’s Intl. FSV’s FCF/EV yield is well above that of key benchmarks.
Figure 18: Free Cash to EV vs. Leverage for Distillate’s Intl Strategy vs. Various Benchmarks
Source: FactSet, See end-notes for methodology.
Final Word
There is no shortage of memes, quotes, or clever angles we might have used to sum things up. “Wash, rinse and repeat” was one suggested by a client who pointed out that we’ve been highlighting the same concerns for some time. Another was the famous 2007 Chuck Prince quote from his brief tenure as CEO of Citibank (C) just when just before it nearly followed the path of Bear Stearns (BSC) and Lehman Brothers (LEH), he acknowledged “when the music stops…things will be complicated. But as long as the music is playing, you’ve got to get up and dance.” There were several other quotes we considered.
Then, Bloomberg’s annual review of Wall Street expectations for 2026 was printed. It reviewed 60+ different firms’ 2026 outlooks for the economy and markets. The article summary: “Across the investment outlooks from more than 60 institutions, compiled here by Bloomberg News, the optimism is almost universal”. We would add that market valuations seem to confirm that summary.
When you dive further into the details of the 2026 outlooks that on average call for another year of low to mid-teens growth in the S&P 500, what is somewhat stunning is that many go on to raise concerns about longer-term risks, with valuation chief among them. A number even suggest that a bubble is present. But, as the logic goes, that is a concern for further down the road since valuations aren’t yet as extreme as in 2000, AI spending is likely to roll on, interest rate cuts are likely (despite many noting that such cuts could signal a worrying waning of Fed independence), and profits as measured by earnings per share should keep rising.
The level of near-term optimism is disconcerting. Successful investing isn’t so much about what happens, but what happens relative to what is already embedded in prices. High levels of optimism are corroborated by valuation multiples and this combination leaves little room for disappointment. Among Warren Buffett’s most quotable lines, “Be fearful when others are greedy, and greedy when others are fearful” comes to mind.
For our strategies, capital preservation is paramount. This means trying to avoid those stocks where, when multiples decline and returns stand to suffer mightily (as has happened following every other period when valuations have reached current levels), we have instead taken shelter in safer and better valued portions of the market. Our strategies look extremely differentiated from their benchmarks currently as a result.
Second, we have made the point prior, but fundamentals are the only real driver of returns in the long-term. Multiples, either measured against earnings or cash flows, oscillate over time and are largely mean reverting (see again Figures 4 & 6 ). What is a tailwind becomes a headwind and vice versa. Rather than attempting to time these cycles, we instead focus on fundamentals as the more sustainable driver of returns and rely on the substantial benefit that comes from rebalancing on a quarterly basis.
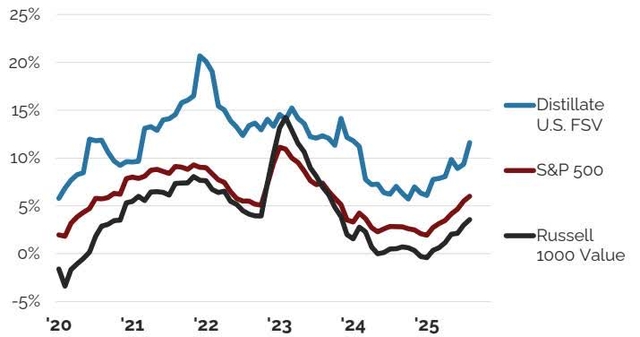
By systematically selling or reducing positions where valuations become more expensive and reinvesting the proceeds into less expensive stocks where each dollar can purchase a greater amount of underlying free cash flow, we earn a better than market rate of free cash flow growth. That benefit was highlighted earlier but is shown again in Figure 19 below which shows the consistency with which our U.S. FSV strategy has generated better fundamental growth than its benchmarks. Whether the market corrects and valuation multiples decline, as has been the case historically from current levels, or if multiples simply become exhausted and hold at current levels, we believe this compounding advantage is one of tremendous significance for future returns.
While we cannot predict when and how the environment will change, our strategies are crafted to systematically follow Buffett’s advice, leaning toward being fearful at the moment with the prospect of being greedy at a later date when warranted.
Combining growth in real free cash flow per share and dividends as was done in Figure 4 back to 1900 to highlight this as the only sustainable driver of returns, shows that Distillate’s fundamental growth has been consistently better than that of either benchmark.
Figure 19: 3 Year Annualized Change in Fundamentals* for Distillate’s U.S. FSV vs. Benchmarks
* Adds dividend contribution to return plus growth in real NTM FCF Source: FactSet; data as of December 2025
Performance & Rebalance Appendix
U.S. Fundamental Stability & Value Composite Performance:
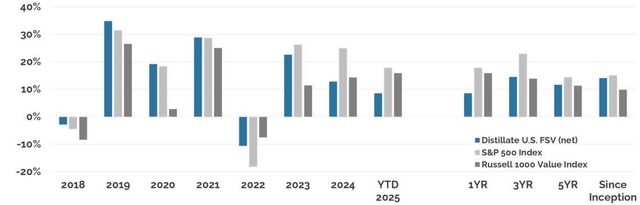
Source: U.S. Bank, Morningstar Data; Inception 5/31/2017; the period “2017*” reflects returns from inception through 12/31/2017. One cannot invest directly in an index. See performance disclosures.
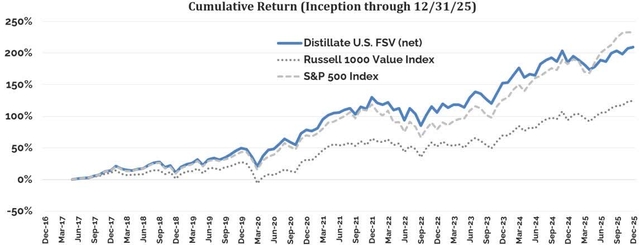
Cumulative Return (Inception through 12/31/25)
Source: U.S. Bank, Morningstar Data; Inception 5/31/2017. One cannot invest directly in an index. See performance disclosures.
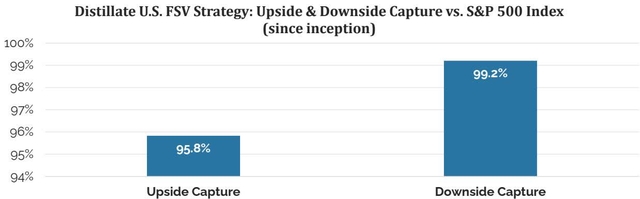
Distillate U.S. FSV Strategy: Upside & Downside Capture vs. S&P 500 Index (since inception)
Source: Zephyr Analytics, see definition
Past performance does not guarantee future results. See disclosures.
Upside Capture reflects the relative compounded annualized return of a strategy compared to that of the benchmark in periods (months) when the benchmark rose in value; Downside Capture is the same but for periods when the benchmark fell in value. One cannot invest directly in an index.
Top Contributors and Detractors From Relative Performance:
U.S. FSV Strategy: Owned Stocks 2025 YTD Impact to Relative Returns (vs. S&P 500)
Rebalance Summary:
U.S. FSV Strategy: Portfolio Changes During Recent Quarterly Rebalancing
Rebalance Calculation Date: 12/26/2025
U.S. FSV Portfolio Characteristics*
*as of 12/31/2025, see methodology endnotes.
U.S. FSV Portfolio Sector Weights
*as of 12/31/2025
Past performance does not guarantee future results. Top contributors and detractors are calculated gross of fees and use end of day pricing, which might differ from actual transactions. The top contributors and top detractors represent extracted performance. Strategy level net performance is available on the previous page and upon request. For the Rebalance Summary, position weights and changes are as of the portfolio reconstitution calculation date and data may vary slightly compared to actual implementation based on price fluctuations. Statistical data is sourced from FactSet. Portfolio holdings may change at any time without notice.
U.S. Small/Mid Cap Quality & Value Composite Performance:
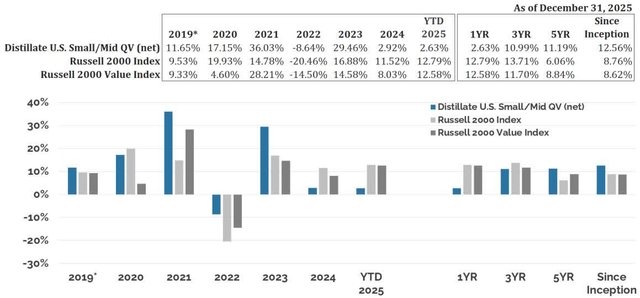
As of December 31, 2025
Source: U.S. Bank, Morningstar Data; Inception 3/31/2019; the period ‘2019*’ reflects returns from inception through 12/31/2019. One cannot invest directly in an index. See performance disclosures.
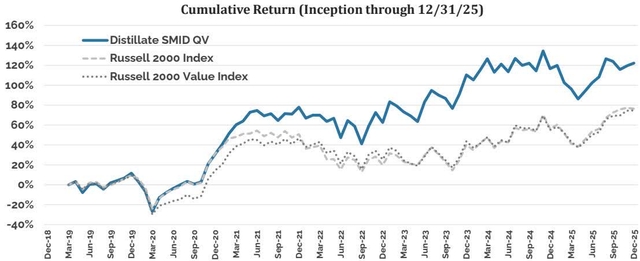
Cumulative Return (Inception through 12/31/25)
Source: U.S. Bank, Morningstar Data; Inception 3/31/2019. One cannot invest directly in an index. See performance disclosures.
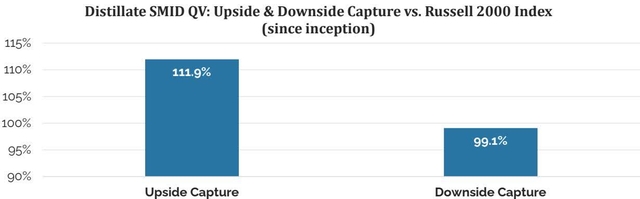
Distillate SMID QV: Upside & Downside Capture vs. Russell 2000 Index (since inception)
Source: Zephyr Analytics, see definition
Past performance does not guarantee future results. See disclosures.
Upside Capture reflects the relative compounded annualized return of a strategy compared to that of the benchmark in periods (months) when the benchmark rose in value; Downside Capture is the same but for periods when the benchmark fell in value. One cannot invest directly in an index.
Top Contributors and Detractors From Relative Performance:
U.S. SMID QV: Owned Stocks 2025 YTD Impact to Relative Returns (vs. Russell 2000)
Rebalance Summary:
U.S. SMID QV Strategy: Portfolio Changes During Recent Quarterly Rebalancing
Rebalance Calculation Date: 11/25/2025
U.S. SMID QV Portfolio Characteristics*
*as of 12/31/2025, see methodology endnotes.
U.S. SMID QV Portfolio Sector Weights
*as of 12/31/2025
Past performance does not guarantee future results. Top contributors and detractors are calculated gross of fees and use end of day pricing, which might differ from actual transactions. The top contributors and top detractors represent extracted performance. Strategy level net performance is available on the previous page and upon request. For the Rebalance Summary, position weights and changes are as of the portfolio reconstitution calculation date and data may vary slightly compared to actual implementation based on price fluctuations. Statistical data is sourced from FactSet. Portfolio holdings may change at any time without notice.
International Fundamental Stability & Value Composite Performance:
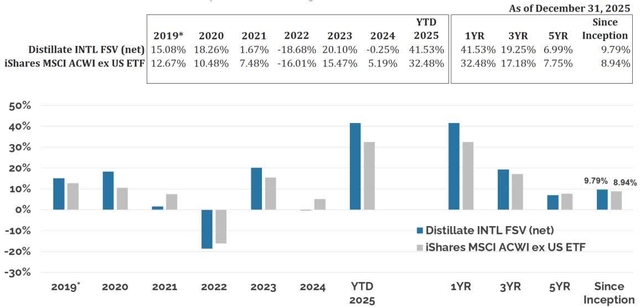
Source: U.S. Bank, Morningstar Data; Inception 1/31/2019; the period “2019*” reflects returns from inception through 12/31/2019. One cannot invest directly in an index. See performance disclosures.
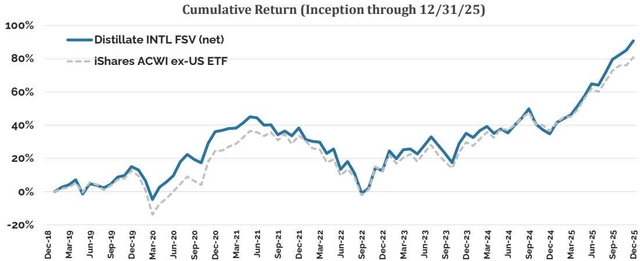
Source: U.S. Bank, Morningstar Data; Inception 1/31/2019. One cannot invest directly in an index. See performance disclosures.
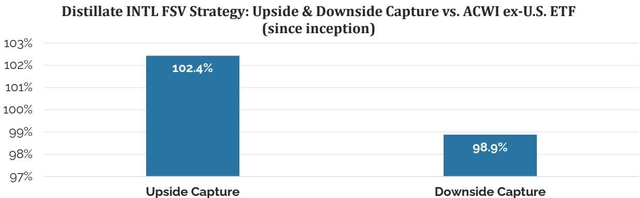
Distillate INTL FSV Strategy: Upside & Downside Capture vs. ACWI ex-U.S. ETF (since inception)
Source: Zephyr Analytics, see definition
Past performance does not guarantee future results. See disclosures.
Upside Capture reflects the relative compounded annualized return of a strategy compared to that of the benchmark in periods (months) when the benchmark rose in value; Downside Capture is the same but for periods when the benchmark fell in value. One cannot invest directly in an index.
Top Contributors and Detractors From Relative Performance:
INTL FSV Strategy: Owned Stocks 2025 YTD Impact to Rel Returns (vs. ACWI Ex U.S.)
Rebalance Summary:
INTL FSV Strategy: Portfolio Changes During Recent Quarterly Rebalancing
Rebalance Calculation Date: 12/26/2025
INTL FSV Portfolio Characteristics*
INTL FSV Portfolio Region Weights
*as of 12/31/2025
*as of 12/31/2025, see methodology endnotes.
Past performance does not guarantee future results. Top contributors and detractors are calculated gross of fees and use end of day pricing, which might differ from actual transactions. The top contributors and top detractors represent extracted performance. Strategy level net performance is available on the previous page and upon request. For the Rebalance Summary, position weights and changes are as of the portfolio reconstitution calculation date and data may vary slightly compared to actual implementation based on price fluctuations. Statistical data is sourced from FactSet. Portfolio holdings may change at any time without notice.
U.S. Large Cap Value 130/30 Composite Performance:
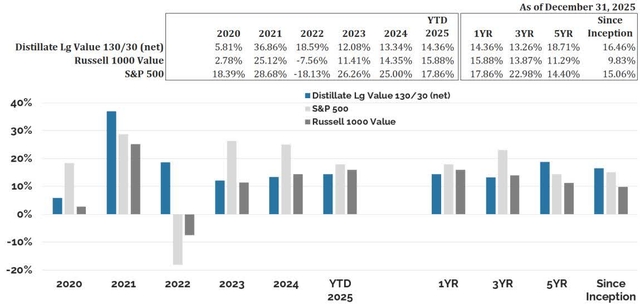
As of December 31, 2025
Source: U.S. Bank, Morningstar Data; Inception 12/31/2019. One cannot invest directly in an index. See performance disclosures.
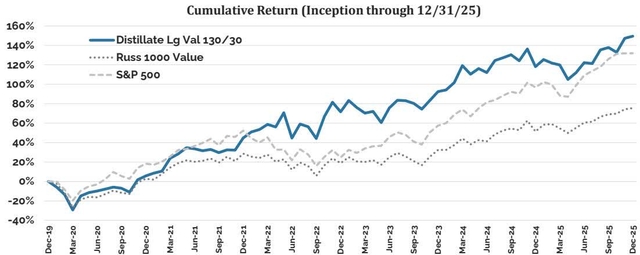
Cumulative Return (Inception through 12/31/25)
Source: U.S. Bank, Morningstar Data; Inception 12/31/2019. One cannot invest directly in an index. See performance disclosures.
U.S. Value 130/30 Portfolio Characteristics*
*as of 12/31/25, see methodology endnotes.
Past performance does not guarantee future results. See disclosures. Statistical data is sourced from FactSet.
Valuation: Next 12-Month Free Cash Flow to Enterprise Value
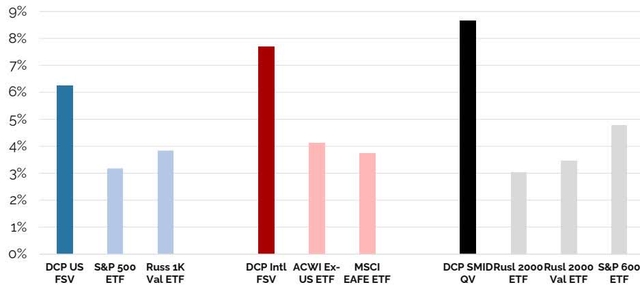
Source: FactSet. See end-notes for methodology. As of 12/31/2025
Quality: Distillate’s Cash Flow Stability Score
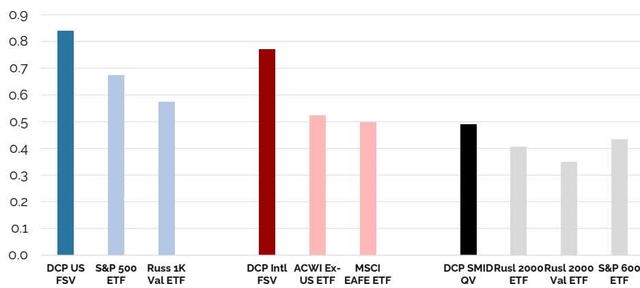
Source: FactSet. See end-notes for methodology. As of 12/31/2025
Quality: Net Debt to Adjusted EBITDA
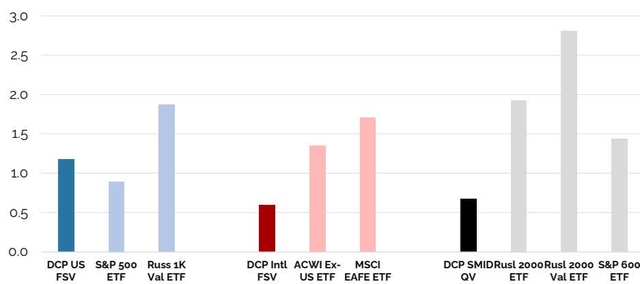
Source: FactSet. See end-notes for methodology. As of 12/31/2025
Original Post
Editor’s Note: The summary bullets for this article were chosen by Seeking Alpha editors.
Read the full article here