
High-Yield Aristocrats: The Ultimate “Anti-Tech” Investment
It’s mathematically accurate that as long as big tech keeps growing as expected, then the PEG 1 of the Mag 7 means this isn’t a bubble, and the S&P has up to 26% upside potential in the next 12 months.
- It’s not a forecast; it is just what fundamentals would justify if S&P earnings grow as expected.
- And if, and only if, current long-term growth estimates remain stable.
But what if you are less confident in the Mag 7 and S&P earnings growth power?
If you’re worried about a potential recession or the growth mega bull market is about to end (for whatever reason), consider high-yield dividend aristocrat investing.
Income today is, by definition, less speculative than income in the future, and the dividend aristocrats are the most dependable sources of immediate income.
TC Energy (NYSE:TRP) (TSX:TRP:CA): The Newest Aristocrat Of 2024
TC Energy will raise its dividend for the 25th consecutive year, becoming a global aristocrat.
A year ago, I was pounding the table about TRP after uncertainty around its plan to split into two companies caused the yield to soar to the highest level in 23 years.
YCharts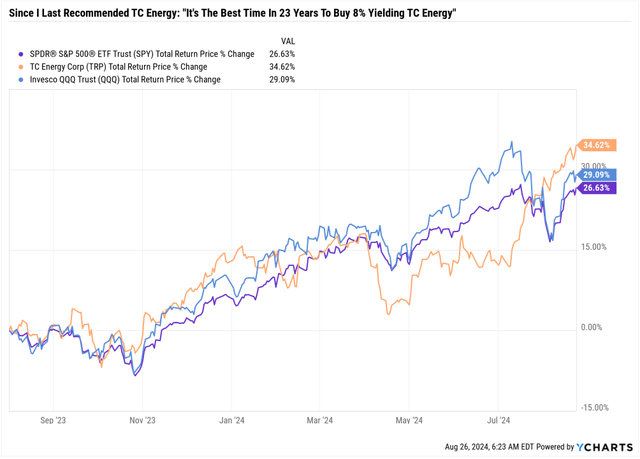
TRP has since soared 35%, outperforming the S&P and Nasdaq.
Let me share three reasons why TC Energy is a wonderful high-yield aristocrat opportunity for conservative income investors.
- “conservative” in the sense of “less speculative.”
- Not politically.
If management is correct, I’ll show you why TRP can potentially deliver 13.3% long-term returns, Nasdaq-like returns, from an aristocrat yielding a very low risk of 6.3%.
Reason One: A Wonderful Business For High-Yield Investors
TC Energy Corporation, founded as TransCanada Corporation in 1951, is the second-largest North American midstream company headquartered in Calgary, Alberta, Canada.
The company operates an extensive midstream infrastructure network, including a 92,600-kilometer (57,538.95-mile) natural gas pipeline that supplies over 25% of North America’s natural gas demand and a 4,900-kilometer (3,044.57-mile) oil pipeline transporting 590,000 barrels of crude oil daily, which accounts for about 20% of Western Canadian exports.
TC Energy has paid growing dividends for 24 consecutive years, showcasing its commitment to returning value to shareholders. The company’s operations span Canada, the United States, and Mexico, encompassing natural gas and liquids pipelines, power generation, and energy storage facilities.
It’s the most diversified midstream in North America.
TC Energy TC Energy

TRP is the natural gas king of North America, supplying 30% of the gas used by the US, Canada, and Mexico.
The WCSB is the Western Canada Shale Basin, the largest natural gas formation on earth.
Appalachia is the Utica and Marcellus shale formation, the world’s 2nd largest natural gas deposits.
According to the US Energy Information Administration, natural gas production will continue growing through 2050 as gas replaces coal as a bridge fuel in the renewable energy transition.
Dividend Kings Zen Research Terminal 
Let’s look at the fundamentals up front. Based on over 1,000 fundamental metrics, TC Energy is yielding a very low risk, 6.3%, with a 92% DK safety score.
| Rating | Dividend Kings Safety Score | Approximate Dividend Cut Risk (Average Recession) | Approximate Dividend Cut Risk In Pandemic Level Recession |
| 1 – unsafe | 0% to 20% | over 4% | 16+% |
| 2- below average | 21% to 40% | over 2% | 8% to 16% |
| 3 – average | 41% to 60% | 2% | 4% to 8% |
| 4 – safe | 61% to 80% | 1% | 2% to 4% |
| 5- very safe | 81% to 100% | 0.5% | 1% to 2% |
| TRP | 98% | 0.5% | 1.1% |
| S&P Risk Rating | 88% Percentile, Very Good | BBB+ Negative outlook credit rating = 5% 30-year bankruptcy risk | 20% or Less Max Risk Cap |
(Source: Dividend Kings Research Terminal)
TRP’s overall 85% quality score is Ultra SWAN (sleep well at night) quality, meaning wide moat aristocrat-level quality.
The median long-term consensus growth rate is 6.2%, similar to management’s 7% long-term growth guidance.
TC Energy
That means long-term return potential of 6.3% yield + 6.2% to 7% growth (dividend growth) = 12.5% to 13.3% long-term returns (and income growth if you reinvest dividends).
Management has reiterated this guidance more recently.
TC Energy
TRP is the 2nd most utility-like midstream behind ENB (ENB).
- ENB 98% cash flow under long-term contracts + regulated.
- TRP 97% cash flow under long-term contracts + regulated.
TC Energy
TRP is more utility-like than most utilities, and far more so than most midstream.
TC Energy
TRP is about to become a pure-play natural gas and electric utility.
S&P rates TRP as BBB+, indicating a 5% risk of default (bankruptcy) within 30 years.
S&P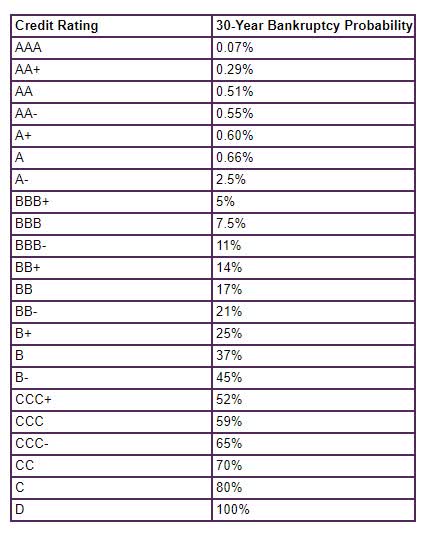
TRP’s long-term risk management is in the top 12% of global companies (see risk section).
Update About The South Bow Spinoff
TC Energy
TC has decided to name the legacy oil pipeline business South Bow. It is focused on maximum safe income with inflation-adjusted income growth.
TC Energy
TC Energy will give existing investors 0.2 shares of South Bow for every share of TRP they own.
TC Energy
Management’s guidance has been extended to 2030, and it is the 3rd best in the industry behind ENB and EPD.
The dividend might be adjusted, but investors will be made whole, and the company will retain its quarter-century dividend growth streak.
TC Energy
Management is guiding for 4% dividend growth in the future as it attempts to bring the payout ratio down to even safer levels.
TC Energy Consensus Payout Ratios
| Year | Dividend | Cash Flow Per Share | Payout Ratio |
| 2023 | $2.76 | $5.15 | 53.59% |
| 2024 | $2.84 | $5.63 | 50.44% |
| 2025 | $2.92 | $5.87 | 49.74% |
| 2026 | $3.00 | $6.19 | 48.47% |
| Annualized | 2.8% | 6.3% | -3.3% |
(Source: FactSet)
According to rating agencies, 83% payout ratios are considered safe in this industry, and TRP’s payout ratio is already among the lowest in the industry. It is expected to fall 3% annually over time.
That will give TC Energy extra financial flexibility, an improved credit rating, and possibly even the ability to achieve an Enterprise Products Partners (EPD) like free cash flow self-funding business model.
That’s the platinum standard of safety in this industry, in which a midstream funds all growth, including growth spending, through internal cash flow and then pays the dividend out of free cash flow, with some left over for an extra safety cushion.
This is almost unheard of in the utility (or REIT) sector, where growth spending is funded with debt (and usually equity issuances).
TC Energy Consensus Leverage Ratio Forecast
| Year | Debt/EBITDA | Net Debt/EBITDA (5 Or Less Safe According To Credit Rating Agencies) |
Interest Coverage (2+ Safe) |
| 2023 | 5.75 | 5.49 | 1.94 |
| 2024 | 5.56 | 5.35 | 1.95 |
| 2025 | 5.45 | 5.33 | 1.93 |
| 2026 | 5.16 | 5.13 | 1.90 |
| 2027 | 5.26 | 5.04 | NA |
| 2028 | 4.73 | NA | NA |
| 2029 | 4.60 | NA | NA |
| Annualized Change | -3.6% | -2.2% | -0.6% |
(Source: FactSet)
TC Energy has been steadily deleveraging while growing its dividends.
S&P
Management has stated it plans to maintain a 4.5X to 5X leverage ratio, which S&P believes will occur beyond 2026 and analysts believe will be achieved in 2027.
That would result in an upgrade to BBB+ stable, with the same credit rating as Enbridge.
Reason Two: Dependable Growth For Decades To Come
TC Energy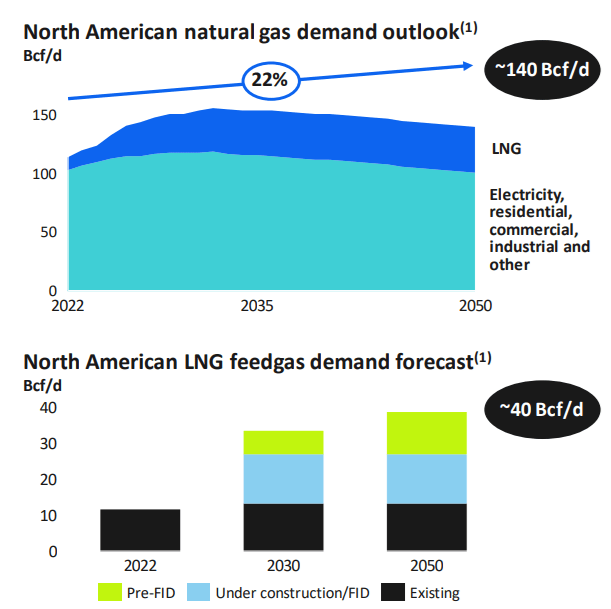
The key to TRP’s long-term growth plan is a switch to natural gas, including liquified natural gas, which is expected to generate stable demand for natural gas infrastructure for several more decades.
TC Energy
TRP expects to invest about $5 billion per year in growth spending beyond 2024, focusing on maximizing the profitability of its capital.
Specifically, it seeks to maximize the spread between its cost of capital and cash return on invested capital, the investment spread.
- This is Realty Income’s (O) strategy as well.
TC Energy
TRP’s historical investment spread is 7.5%, and it believes it can maintain 6% to 7% investment spreads even in a normal interest rate environment.
TC Energy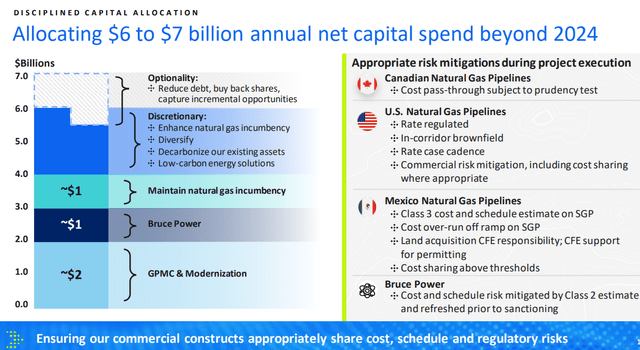
Bruce Power is Canada’s only private-sector nuclear generator, established in 2001 as a partnership between TC Energy, OMERS, the Power Workers’ Union, and The Society of United Professionals. It operates the Bruce Nuclear Generating Station, located on the eastern shore of Lake Huron in Ontario, one of the world’s largest nuclear power facilities. Bruce Power supplies approximately 30% of Ontario’s electricity through its eight nuclear reactors, which have a combined capacity of 6,400 megawatts.
TRP is committed to providing carbon-free electricity and is engaged in a significant Life-Extension Program to refurbish its reactors, ensuring a reliable power supply until 2064. Bruce Power also produces medical isotopes used in cancer treatments and medical device sterilization, and is actively involved in community and economic development initiatives within Ontario.
TC Energy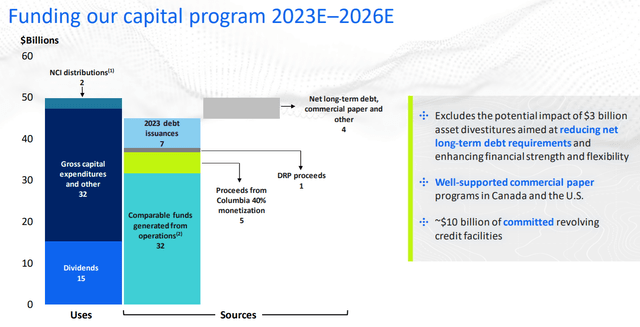
TRP’s growth plans have been funded, other than the 3 billion CAD expected borrowing that S&P and management expect to be required to fulfill the growth plan.
TC Energy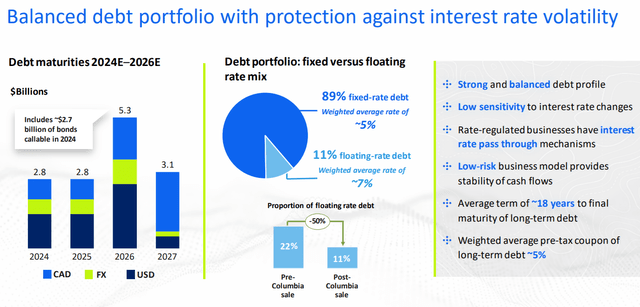
TRP’s debt profile is highly conservative. It has 89% fixed-rate debt, with an average maturity of 18 years. Its average borrowing cost is now 5%, just 1.3% above the risk-free 10-year Treasury yield.
Wide Moat Research 
According to JPMorgan, 1980, two in three energy investments since 1980 have turned into a “permanent, catastrophic” decline of 70% or more.
That’s because oil is cyclical, and most oil stocks fail to make money.
Most small oil companies go bankrupt, and a medium-sized one might be acquired by a larger one, locking in huge losses for investors.
- You lock in losses if you’re down 70% and someone buys your stock at a modest premium.
This is why energy aristocrats are a wonderful low-risk alternative to energy investing.
Historical Returns Since 1985
Portfolio Visualizer
TC Energy and oil aristocrats like Exxon (XOM) and Chevron (CVX) have delivered impressive long-term returns and income over the last four decades.
Portfolio Visualizer
For 40 years, the average rolling return across all time frames is 12% to 13%, just as management is guiding for today and what analysts expect in the future.
Portfolio Visualizer
TRP’s low volatility (0.53 beta) nature is courtesy of its utility-like business model.
That’s why it has delivered 5% alpha (volatility-adjusted excess returns) relative to the S&P for four decades.
Its volatility-adjusted returns are also impressive, including 2X the excess returns per unit of volatility as the S&P.
- Treynor ratio: excess total return vs risk-free bonds per unit of volatility.
Portfolio Visualizer
TRP has historically delivered 60% of the market’s gains in good times and 47% of the market’s downside in bad times.
That’s the key to its long-term success: a low-volatility source of dependable income that grows in all economic and market conditions.
Portfolio Visualizer
$1,000 Investment In 1985
| Metric | TC Energy | Exxon | Chevron |
| Total Income | $27,864.73 | $14,979.22 | $33,467.21 |
| Inflation-Adjusted Income | $9,350.58 | $5,026.58 | $11,230.61 |
| Starting Yield | 5.09% | 1.13% | 7.48% |
| Yield On Cost | 250.8% | 206.9% | 499.10% |
| Inflation-Adjusted Yield On Cost | 84.17% | 69.42% | 167.48% |
| Income Growth Rate | 10.9% | 14.6% | 10.6% |
(Source: Portfolio Visualizer)
TC Energy has grown its income at 11% annually for almost 40 years, turning a 5% starting yield into a 251% yield on cost. That means, adjusted for inflation, for every $1,000 invested in 1985, investors are now getting $841.70 per year in dividends that are still growing exponentially.
OK, that’s impressive historical returns and income growth. And TC Energy’s ability to continue driving about 6% to 7% dividend growth in the future is potentially set to continue for decades.
FactSet FactSet
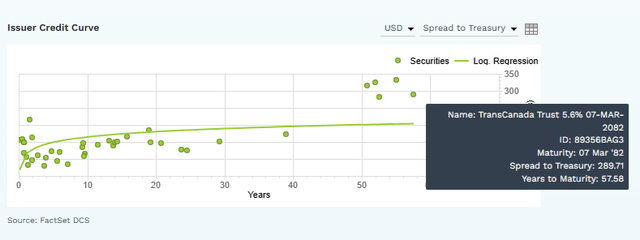
TRP’s longest-duration bonds mature in 58 years. They were sold two years ago at a yield of 5.6%.
Today, despite the Fed hiking 5%, those bonds yield 6.3%, 2.9% more than risk-free 10-year US treasury bonds.
This tells us that the “smart money on Wall Street,” the bond market, is confident that TRP will be around and pay its debts without any problem six decades from now.
Reason Three: A Wonderful Company At A Good Price
- Fair Value: $49.11
- Current Price: $45.57
- Discount: 7.21%
- DK Rating: Potentially good buy
TC Energy 2026 Consensus Total Return Potential
FAST Graphs, FactSet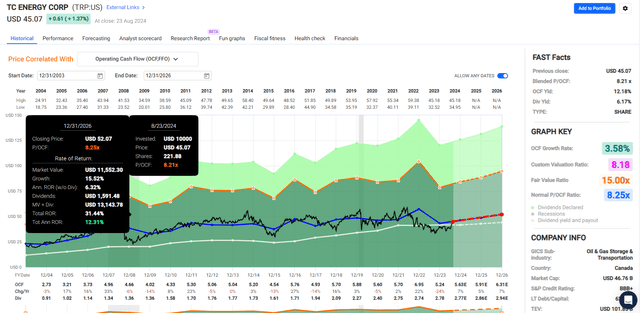
TC Energy 2029 Consensus Total Return Potential
FAST Graphs, FactSet
Risk Profile: Why TC Energy Isn’t Right For Everyone
TRP is a Canadian corporation with no K1 tax form and qualified dividends.
However, there is a 15% tax withholding in taxable accounts (not retirement accounts).
You can recoup this via a tax credit, but it will require additional paperwork for most investors (with over $600 in withholdings).
As for fundamental risks, the largest to the thesis is fusion power.
Remember that demand for natural gas is expected to grow for the next decade, remain stable through 2050, and decline gradually.
That’s because natural gas is expected to be the base-load power source to which green energy will be added.
However, if fusion power becomes practical, the transition from gas to green energy could be accelerated by several decades (a 20- to 30-year faster decline in natural gas demand).
And that’s just one example of what might go wrong with TRP’s investment thesis in the future.
S&P
S&P has quantified over 1,000 kinds of long-term business risks, which is part of its credit rating system.
| S&P LT Risk Management Score | Rating |
| 0% to 9% | Very Poor |
| 10% to 19% | Poor |
| 20% to 29% | Suboptimal |
| 30% to 59% | Acceptable |
| 60% to 69% | Good |
| 70% to 79% | Very Good |
| 80+% | Exceptional |
| TRP | 64.04% |
| Global Percentile | 87.55% |
(Source: S&P)
TC Energy is rated 64% optimal risk management.
- In each risk, S&P compares a company to the #1 rated company.
- 64% optimal compared to the best company for each kind of risk.
That works out to the top 12% of global companies, which have a strong corporate culture and excellent risk management for conservative income investors.
But remember that Ultra Sleep Well At Night Aristocrats are not risk-free, while the bluest blue chips are the safest.
Nor do they mean, “you’ll sleep well at night because of low volatility.”
Safety and quality tell you how safe your dividends are, the risk of a permanent loss of capital, and what Buffett defines as “fundamental risk.”
What Drives All Dividend Kings Valuation Ratings (Dividend Kings)
Quality and safety ratings have zero to do with volatility, unless the quality is so low that the company risks permanently failing.
Even Ultra-SWAN Aristocrats Can Be Volatile
Portfolio Visualizer Portfolio Visualizer
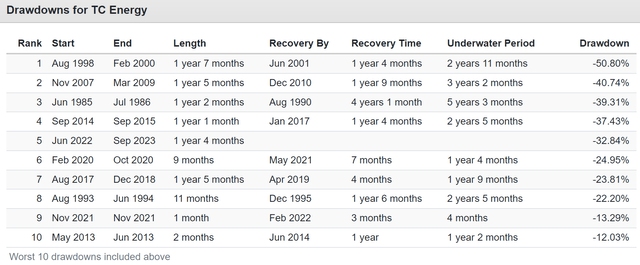
Worst 10% Of Months Since 1985
| TC Energy | Exxon | Chevron | Vanguard 500 Index Investor | ||
| Year | Month | Return | Return | Return | Return |
| 1999 | 12 | -18.81% | 1.58% | -2.19% | 5.98% |
| 2008 | 10 | -16.18% | -4.56% | -9.55% | -16.79% |
| 2000 | 2 | -16.03% | -9.48% | -9.94% | -1.91% |
| 1998 | 8 | -14.90% | -6.57% | -9.68% | -14.47% |
| 2020 | 3 | -14.20% | -26.19% | -22.37% | -12.37% |
| 2021 | 11 | -13.29% | -5.91% | -0.27% | -0.71% |
| 2022 | 9 | -13.29% | -8.66% | -9.10% | -9.22% |
| 2008 | 11 | -12.97% | 8.72% | 6.86% | -7.17% |
| 1985 | 10 | -12.84% | 6.02% | 5.74% | 4.40% |
| 1990 | 4 | -12.82% | -1.90% | -2.41% | -2.50% |
| 1986 | 2 | -11.71% | 1.20% | 2.39% | 7.58% |
| 2018 | 12 | -11.52% | -14.23% | -8.53% | -9.04% |
| 2023 | 7 | -11.23% | -0.01% | 4.01% | 3.20% |
| 1987 | 11 | -11.00% | -13.52% | -16.60% | -8.19% |
| 2024 | 4 | -10.82% | 1.75% | 2.24% | -4.10% |
| 2009 | 2 | -10.39% | -10.78% | -13.11% | -10.66% |
| 1988 | 5 | -10.31% | 0.59% | 3.74% | 0.81% |
| 1989 | 5 | -10.00% | 0.33% | 3.19% | 4.04% |
| 1986 | 1 | -9.76% | -6.12% | -4.26% | 0.43% |
| 2015 | 8 | -9.67% | -4.12% | -7.29% | -6.05% |
| 1990 | 9 | -9.64% | -2.00% | -2.47% | -4.89% |
| 2022 | 8 | -9.60% | -0.45% | -2.63% | -4.09% |
| 2015 | 1 | -9.41% | -5.44% | -8.60% | -3.02% |
| 1986 | 6 | -9.37% | 1.67% | -4.06% | 1.67% |
| 2022 | 6 | -9.23% | -10.79% | -17.11% | -8.27% |
| 2022 | 12 | -8.88% | -0.93% | -2.08% | -5.77% |
| 1987 | 4 | -8.87% | 1.02% | 3.34% | -1.03% |
| 2020 | 9 | -8.68% | -14.05% | -14.21% | -3.81% |
| 2004 | 4 | -8.42% | 2.31% | 4.24% | -1.58% |
| 2009 | 6 | -8.41% | 0.81% | -0.63% | 0.22% |
| 1999 | 11 | -7.77% | 7.40% | -2.36% | 2.02% |
| 2023 | 2 | -7.72% | -4.53% | -6.79% | -2.45% |
| 1999 | 10 | -7.66% | -2.55% | 2.89% | 6.33% |
| 2015 | 9 | -7.64% | -1.18% | -2.61% | -2.48% |
| 1994 | 3 | -7.50% | -3.08% | -3.03% | -4.39% |
| 1988 | 7 | -7.45% | 4.41% | 6.89% | -0.37% |
| 1987 | 10 | -7.41% | -12.34% | -17.63% | -21.73% |
| 2013 | 5 | -7.39% | 2.37% | 1.42% | 2.33% |
| 1986 | 4 | -7.27% | 1.57% | 5.48% | -1.35% |
| 2010 | 1 | -7.16% | -5.51% | -6.33% | -3.60% |
| 2012 | 5 | -6.96% | -8.30% | -6.91% | -6.02% |
| 2002 | 7 | -6.85% | -10.17% | -15.25% | -7.72% |
| 1985 | 12 | -6.81% | 3.28% | -0.33% | 4.67% |
| 2001 | 1 | -6.78% | -3.21% | -1.37% | 3.55% |
| 2018 | 10 | -6.77% | -6.28% | -8.69% | -6.85% |
| 2015 | 5 | -6.57% | -1.66% | -6.34% | 1.27% |
| 1994 | 6 | -6.50% | -7.16% | -3.74% | -2.47% |
| 2000 | 1 | -6.43% | 3.57% | -3.46% | -5.03% |
| 1999 | 9 | -6.42% | -3.65% | -3.86% | -2.74% |
| 1988 | 1 | -6.38% | 10.16% | 13.25% | 4.17% |
| Average | -9.67% | -3.13% | -3.80% | -3.00% | |
| Median | -9.06% | -2.28% | -2.83% | -2.49% |
(Source: Portfolio Visualizer)
TRP’s worst months usually correspond to market corrections. But not continuously, including its worst month, a 19% decline in 1999 during a 5% monthly gain for the S&P.
Best 10% Of Months Since 1985
| TC Energy | Exxon | Chevron | Vanguard 500 Index Investor | ||
| Year | Month | Return | Return | Return | Return |
| 2000 | 8 | 27.64% | 2.31% | 7.82% | 6.19% |
| 1998 | 7 | 21.86% | -1.58% | -1.34% | -1.05% |
| 2009 | 5 | 19.10% | 4.65% | 1.86% | 5.62% |
| 2019 | 1 | 19.10% | 7.46% | 5.39% | 8.00% |
| 2000 | 12 | 16.42% | -1.21% | 3.13% | 0.51% |
| 2007 | 10 | 15.73% | -0.62% | -2.21% | 1.58% |
| 1986 | 3 | 14.34% | 6.70% | -0.68% | 5.48% |
| 2001 | 2 | 13.62% | -3.43% | 3.64% | -9.14% |
| 2000 | 3 | 12.91% | 3.49% | 23.77% | 9.75% |
| 2010 | 3 | 12.60% | 3.05% | 4.88% | 6.01% |
| 2021 | 10 | 12.50% | 9.61% | 12.85% | 6.99% |
| 1987 | 3 | 12.46% | 9.41% | 13.38% | 2.89% |
| 2024 | 7 | 11.90% | 3.01% | 2.59% | 1.20% |
| 1997 | 11 | 11.71% | -0.37% | -2.64% | 4.60% |
| 1988 | 4 | 11.49% | 6.85% | 3.50% | 1.01% |
| 2020 | 11 | 11.33% | 19.65% | 27.30% | 10.94% |
| 2022 | 1 | 10.98% | 24.14% | 11.91% | -5.19% |
| 2003 | 5 | 10.92% | 4.14% | 14.12% | 5.26% |
| 2021 | 3 | 10.74% | 2.69% | 4.79% | 4.37% |
| 2005 | 9 | 10.65% | 6.08% | 5.42% | 0.79% |
| 1988 | 9 | 10.63% | -3.76% | -1.97% | 4.26% |
| 2016 | 6 | 10.15% | 5.30% | 3.79% | 0.25% |
| 2011 | 2 | 10.04% | 6.57% | 10.10% | 3.42% |
| 2005 | 6 | 10.00% | 2.26% | 3.98% | 0.13% |
| 1988 | 6 | 9.99% | 0.83% | -7.87% | 4.56% |
| 2003 | 10 | 9.74% | -0.05% | 3.99% | 5.64% |
| 1989 | 3 | 9.70% | 0.00% | 8.76% | 2.26% |
| 2000 | 5 | 9.65% | 7.53% | 9.36% | -2.04% |
| 1998 | 9 | 9.36% | 7.93% | 13.50% | 6.41% |
| 2022 | 5 | 9.34% | 13.76% | 12.42% | 0.17% |
| 2004 | 11 | 9.28% | 4.69% | 3.69% | 4.05% |
| 1987 | 1 | 9.18% | 18.00% | 16.80% | 13.27% |
| 1994 | 8 | 9.09% | 0.31% | -3.48% | 4.08% |
| 1997 | 12 | 9.04% | 0.31% | -3.98% | 1.72% |
| 2022 | 10 | 9.01% | 26.92% | 25.91% | 8.08% |
| 2023 | 11 | 8.91% | -2.05% | -0.41% | 9.12% |
| 2010 | 12 | 8.80% | 5.12% | 12.70% | 6.67% |
| 1999 | 4 | 8.78% | 17.71% | 12.39% | 3.85% |
| 2015 | 4 | 8.66% | 2.79% | 5.79% | 0.95% |
| 2018 | 11 | 8.48% | 0.79% | 7.55% | 2.03% |
| 2012 | 7 | 8.47% | 1.50% | 3.87% | 1.37% |
| 2016 | 3 | 8.34% | 4.29% | 14.33% | 6.78% |
| 2023 | 1 | 8.23% | 5.18% | -3.05% | 6.27% |
| 1995 | 2 | 8.16% | 2.51% | 7.80% | 3.88% |
| 2003 | 4 | 8.14% | 0.72% | -2.85% | 8.25% |
| 2021 | 4 | 8.13% | 2.53% | -1.64% | 5.32% |
| 1987 | 12 | 7.87% | 3.74% | 8.56% | 7.55% |
| 1989 | 8 | 7.69% | -4.05% | 4.55% | 1.86% |
| 2009 | 12 | 7.64% | -9.16% | -1.35% | 1.95% |
| 2024 | 5 | 7.56% | -0.05% | 1.66% | 4.95% |
| Average | 11.12% | 4.56% | 6.09% | 3.86% | |
| Median | 9.87% | 3.03% | 4.67% | 4.17% |
(Source: Portfolio Visualizer)
TRP’s best months are often during down periods for energy stocks and even major market declines.
That’s the diversification benefit of this volatility, high-yield aristocrat utility.
Bottom Line: TC Energy Is A 6.3% Yielding Aristocrat You Can Buy Before Everyone Else Does
It’s perfectly fine to ignore the market’s irrational bubbles. Often, that’s the best strategy.
While the S&P doesn’t appear in a bubble, TC Energy is a wonderful ultra-yield aristocrat worth considering today for those who want to focus on stable cash flow, a safe 6.3% yield, and utility-like low-volatility stocks.
Read the full article here